AI review and prediction
| Catégorie | Classe |
|---|---|
| Statut | Préparé |
Using AI during assessment and term
Fundamentals
Big Data
- Why data analytics, Data science are important and usefull ?
- Decision-Making ⇒ help to make decision
- Analyze pattern and behaviour
- Predict
- What is Big Data ?
- Le terme Big Data désigne un ensemble de données volumineux, varié et rapide à générer.
- The term Big Data refers to a set of data that is so large, varied, and fast to generate
AI
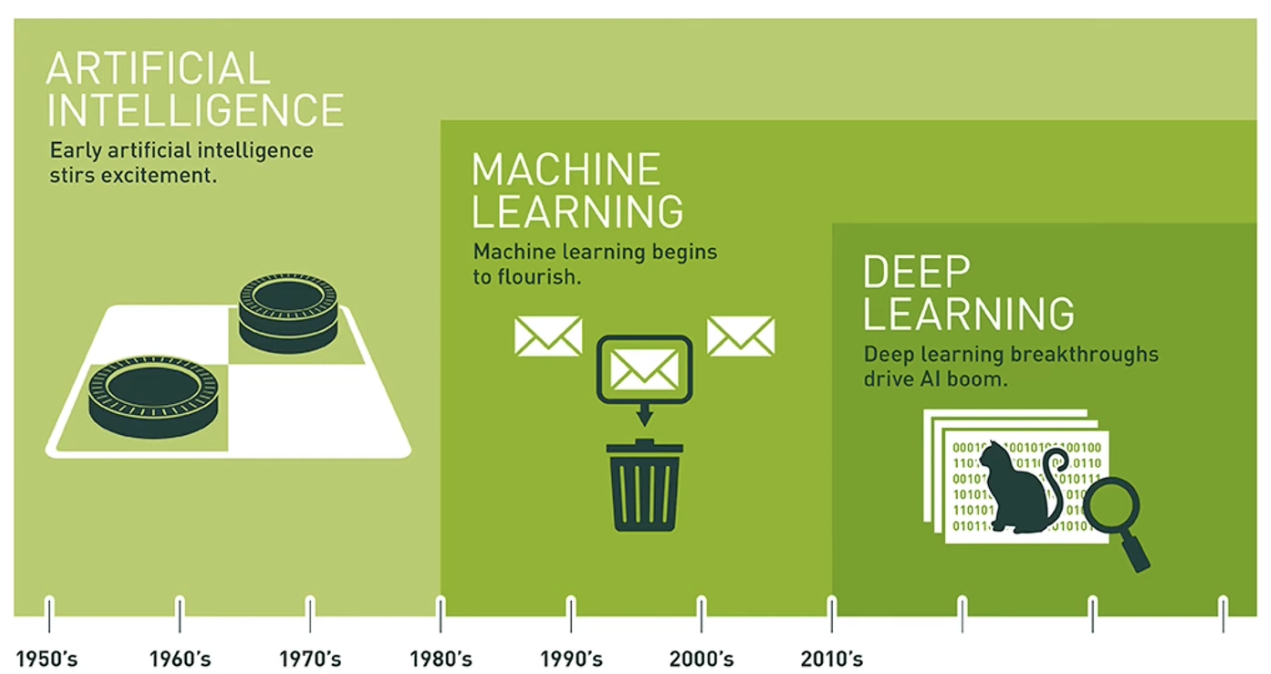
What is AI
Artificial intelligence refers to a set of techniques and computer systems capable of imitating certain functions of human intelligence.
- Understanding language,
- Recognizing images or sounds,
- Learning from data,
- Solving problems or making decisions.
These systems use algorithms, that is, sequences of mathematical instructions, to analyze data and gradually adapt.
Yes, absolutely. We can rephrase it as follows:
Like any application, artificial intelligence, in order to work, needs:
- a machine, such as a computer, a server, or a smartphone,
- data to learn from or to produce results,
- and algorithms (logical or mathematical instructions) to process this data.
What makes it particular is that AI can learn from data and adapt its responses. But in itself, it remains a computer application.
Machine Learning (ML) and Deep Learning (DL) are subcategories of artificial intelligence — specific techniques used in AI software programs.
What is Machine learning
Machine Learning (or "apprentissage automatique" in French) is an artificial intelligence technique that allows a program to learn from data, without being manually programmed for each situation.
What it needs to learn:
- Data,
- An algorithm,
- A training phase, where it learns to make predictions,
- A testing phase, where we check whether it has learned correctly.
What is Deep learning
Deep Learning (DL) is an advanced form of Machine Learning that uses deep artificial neural networks, inspired by the human brain.
Création des logiciels de ML ou DL
We use libraries that allow us to create a program using a Machine Learning or Deep Learning technique.
These are software tools (code libraries) that make it possible to create machine learning or deep learning programs.
| Library | Type | Usage |
|---|---|---|
| Scikit-learn | Machine Learning | For simple models: regression, decision trees, k-means… |
| TensorFlow | Deep Learning (and ML) | To build neural networks, GPU training, etc. |
| PyTorch | Deep Learning (and ML) | Same as TensorFlow, often preferred for research |
| Keras | Deep Learning Interface | Built on TensorFlow, easier to use |
| XGBoost | Machine Learning | Specialized in very powerful tree-based models |
- Machine Learning and Deep Learning are techniques.
- TensorFlow, PyTorch, Scikit-learn… are libraries to program these techniques.
- These libraries are code (often in Python), used in computer applications.
Historical
Alan Turing (1912–1954)
- Pioneer of computing
- As early as 1950, he posed the question: “Can machines think?”
- He invented the Turing test, a foundational idea for AI.
John McCarthy (1927–2011)
- He is often considered the official father of AI.
- In 1956, he organized the famous Dartmouth conference, which marked the birth of the field of artificial intelligence.
- He coined the term “Artificial Intelligence”.
Marvin Minsky, Allen Newell, and Herbert Simon
- Collaborators of McCarthy, they created the first AI programs in the 1950s and 1960s.
Linear regression and prediction
Machine Learning Technique
Linear regression is a simple and powerful form of Machine Learning.
It is used to predict numerical values based on explanatory variables.
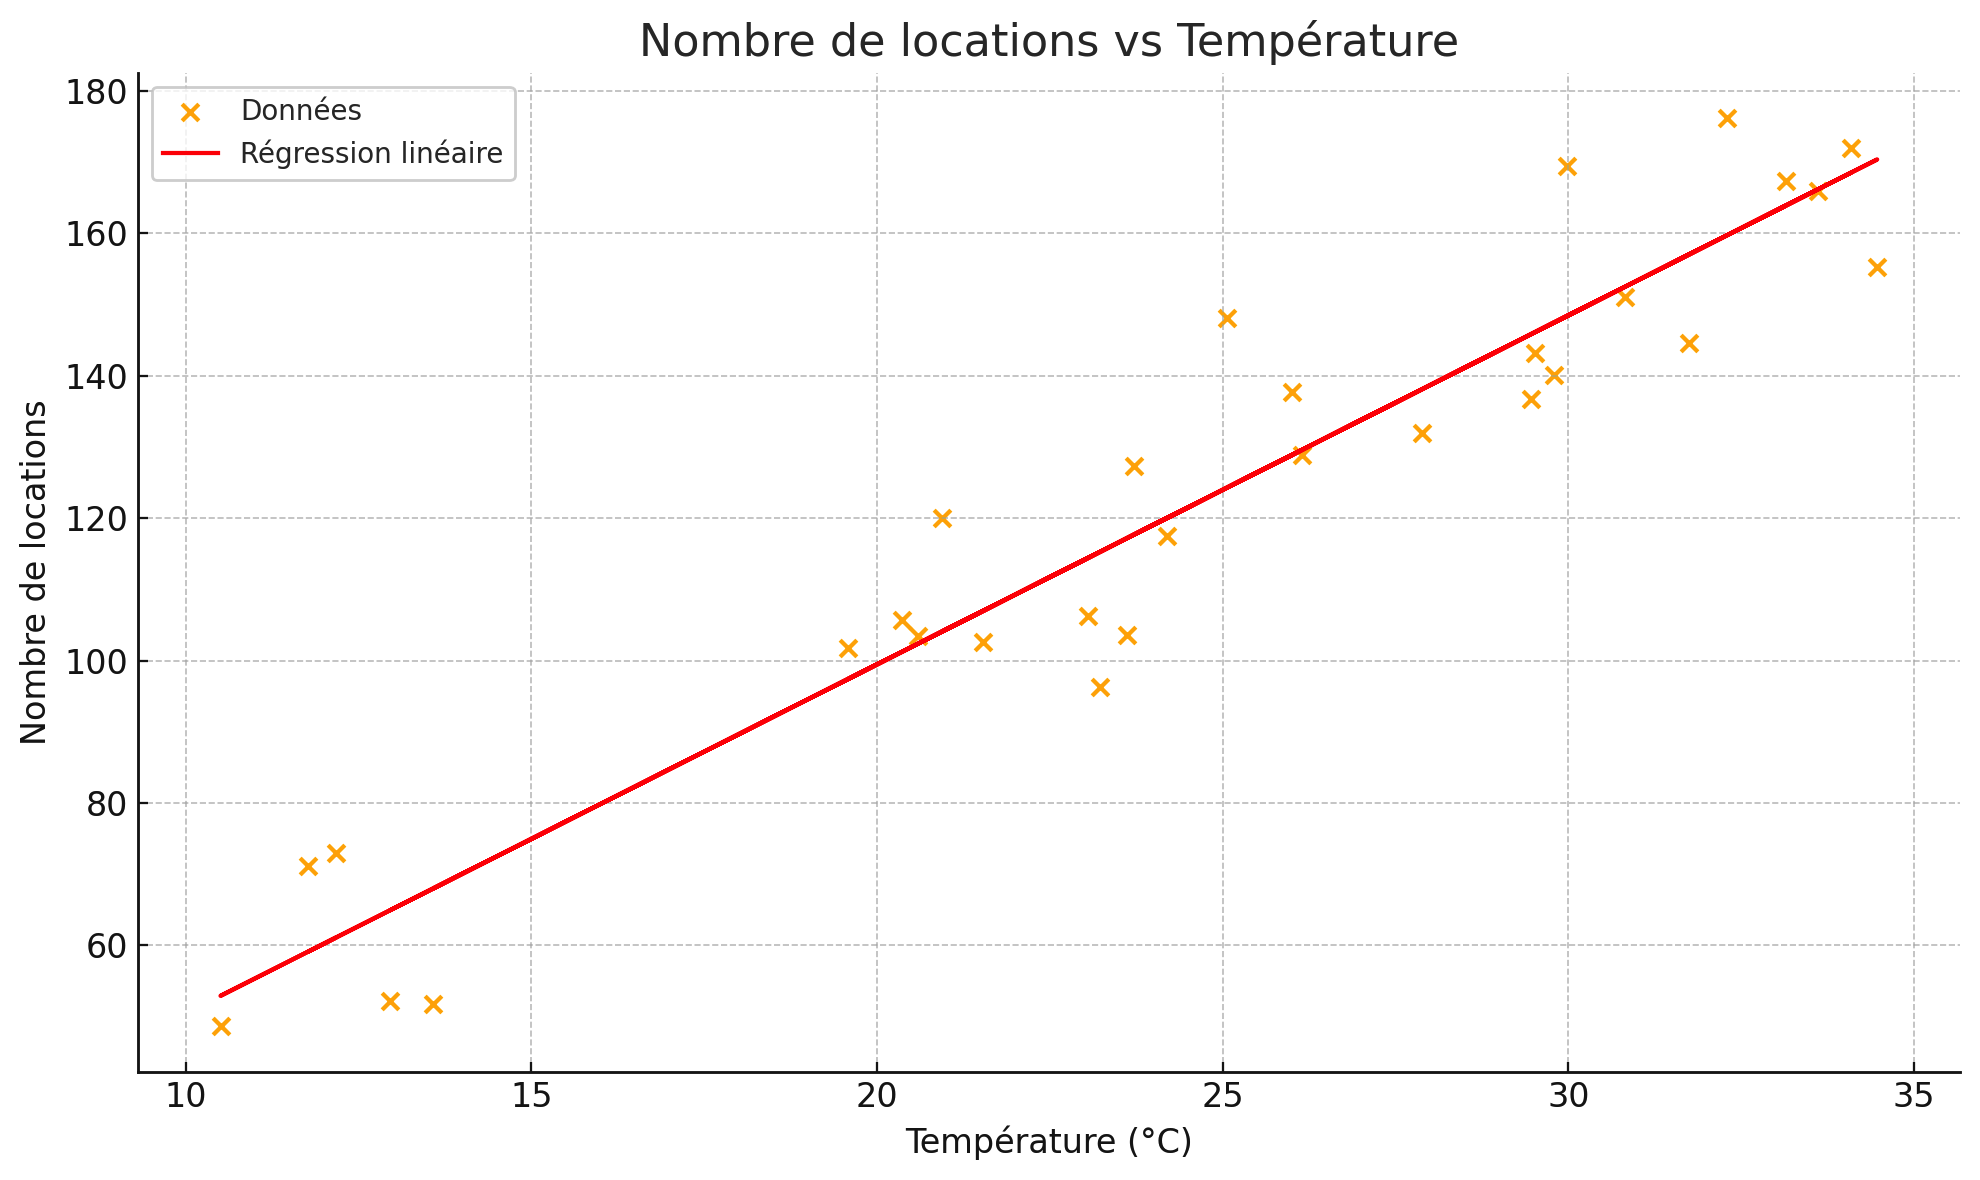
Excel Exercise
Understand how a machine can predict a value from past examples.
- Context: We have bike rental data: number of bikes rented per day, temperature, day of the week.
- Excel file: Columns = Date | Temperature | Day of the week | Number of rentals
- Task:
- Create a scatter plot between Temperature and Number of rentals.
- Add a linear trendline.
- Display the equation and R².
- Use this equation to predict the number of rentals at 25°C.
Answer Key
Enter the data
- In two columns:
- Column A: Temperature (°C)
- Column B: Number of rentals
Température (°C),Nombre de locations
23.720337598183118,127.24604997951064
27.879734159310487,131.97702059248803
25.069084401791095,148.04296824883153
23.622079574922424,103.56674112862447
20.591369983472617,103.41443509037755
26.147352826666403,128.86492563307365
20.939680281567313,120.02619355142114
32.29432501955199,176.1652127967628
34.09156901252573,172.00731931959783
19.58603797064444,101.71181504924394
29.793125952066614,140.08777228403193
23.22237299382261,96.30390028687377
24.201114027348307,117.52644864348001
33.139915957316525,167.26306947762242
11.775901454947174,71.18241408201308
12.178232492538518,72.91496095053671
10.505459936008142,48.65403150596119
30.81549613869845,151.0544531877389
29.453918773746263,136.7840642180604
31.750303706170477,144.55133915906265
34.4654585558191,155.26459087284536
29.97896410541809,169.40257447940834
21.5369840563233,102.58839846409995
29.513229407161386,143.18540401969506
12.956860646723332,52.256349633117395
25.998025533188095,137.76503122425956
13.58383218522616,51.78018245055129
33.616722926239596,165.95621182905828
23.04620804375179,106.27637460682219
20.36654849976309,105.70176747740808
Clean the data
- Column title without space, special characters, uppercase
- Transform into number
- If you need to transform the
.into,=SUBSTITUTE(A2;".";",")
- Create a new column and copy-paste the values
- Change format into number
- Convert to integer
- If you need to transform the
Create the chart
- Select your two data columns.
- Go to Insert > Chart > Scatter plot (XY).
Add the trendline
- Click on a point in the chart to select it.
- Right-click > Add trendline.
- In the pane that opens on the right:
- Check Linear.
- Check Display equation on chart.
- Also check Display R-squared value if you want.
Read the equation
- Right click on the line and click Add equation
- The equation appears on the chart, for example:
y = 4.9x + 1.4
This corresponds to:
Number of rentals = 4.9 × Temperature + 1.4
Use the equation to predict
Prediction using the regression formula
- In an empty cell, type a formula like:
=4.9 * 25 + 1.4
to predict at 25°C.
R²
=1-(SUMPRODUCT((B2:B31-D2:D31)^2)/SUMPRODUCT((B2:B31-AVERAGE(D2:D31))^2))
=PEARSON(B2:B31,D2:D31)^2
- B column: real rental
- D column: predicted rental
Explanation
- y = number of rentals
- x = temperature (°C)
- 4.9 = the slope (the model predicts about 5 more rentals for each additional degree)
- 1.4 = the y-intercept (the model predicts about 1.4 rentals when the temperature is 0°C)
It is an equation that links two variables by finding the best “straight line” that comes closest to all the points.
The method called “least squares” finds the line that minimizes the distance between:
- the actual values (the points on the chart)
- and the values predicted by the line
Steps:
- It analyzes all the points in your table.
- It calculates a line that comes closest to all the points.
- It adjusts the slope (coefficient) and the intercept (constant) to minimize the errors.
- It also calculates R², which indicates how well the line fits the data (0 to 1).
R2
R², or the coefficient of determination, is a statistical indicator that measures how well a regression model explains the data.
| R² Value | Interpretation |
|---|---|
| 1 | The model perfectly explains the data |
| 0.9 | The model explains 90% of the variation |
| 0.5 | The model is moderately reliable |
| 0 | The model explains nothing at all |
| < 0 | The model is worse than a random model (rare but possible) |
Concrete example
If we have:
- temperatures (x)
- and bike rentals (y)
And R² = 0.90
This means that 90% of the variations in the number of rentals are related to temperature.
The model is therefore very good.
Exhibition review
Game : https://mi.hepl.ch/sites/io/ressources.html